The global market today is highly competitive with cut-throat competition to stay on top, and undoubtedly many business firms are doing a much better job at it than others. One of the most important reasons for some businesses performing better is their utilization of Data Science and Analytics.
Data Science and Analytics are interrelated terms that businesses employ to extract information and statistics from their data to make calculated decisions that enhance their performance and help them gain more opportunities and a competitive edge over others. This data-driven approach ultimately leads to better customer satisfaction and helps businesses grow and achieve their goals more efficiently and effectively.
Basics of Data Science & Analytics
Data Science and Analytics is the collection, arranging, and building of datasets to analyze and examine the data to form insights that can be used to make effective data-driven decisions to bring about required changes. This allows businesses to make valuable changes to their strategy putting them on the path of success and growth.
In Data Science and Analytics, a question is usually taken whose answer is determined using various techniques and tools ensuring goal-driven and enhanced working by uncovering otherwise hidden patterns and trends.
Techniques used in Data Science and Analytics
Data Science and Analytics employ a broad range of techniques and tools such as,
- Data Mining
- Data Engineering
- Data Modeling
- Business Intelligence
- Data Visualization
- Statistical Analysis
- Predictive Analytics
- Prescriptive Analytics
- Descriptive and Diagnostic Analytics
- Machine Learning
- Software programming
All these techniques help businesses to extract insight from data uncovering previously hidden patterns and allowing them to make informed and data-driven decisions that put them on the path of growth, innovation, and competitive advancement.

Data Science a Fundamental Demand
This is a data-driven world and everyone wants to stay one step ahead of the competition. Data science empowers businesses to enhance productivity and decision-making by extracting insights from data analysis. which allows them to effectively identify and solve the problems in their business practices helping them stay ahead of the competition, minimize the risks, and increase the chances of success.
Following are some of the most important aspects that make data science and analytics significantly important for businesses around the world,
- Informed and Data-Driven Decision making:
- Risk and Fraud Management
- Performance Measurement
- Operational and Performance Efficiency
- Customer Insights and Satisfaction
- Marketing strategies
- Data-driven Innovation
- Enhanced Product Development
- Predicting Future Trends
Steps of Data Science Analysis
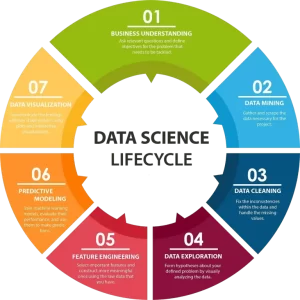
Data science analysis follows definite steps to solve problems effectively such as,
Problem Defining:
This is the most obvious step of defining the problem and asking the exact, clear, and right question that needs to be addressed by data science analysis.
Data Collection:
After knowing the exact problem, if you don’t already have the data the next step is to draw relevant data from different sources that can help you solve your problem.
Preprocessing of the Data:
The initial data can be scattered and messy so the next step is cleaning the data which includes handling of corrupted or missing values and inconsistencies, transforming and scaling of data, and fixing inaccuracies.
Data Analysis:
The most important and key step of the process includes analyzing the datasets to understand the properties of the data, its relationships, patterns, and features. This demands in-process adjustments of parameters to gain all the required insights about data.
This process also utilizes data visualization methods such as graphs and statistical methods to unveil patterns and trends hidden in the data.
Understanding Results:
The results are interpreted to uncover insights and get hidden patterns in the data. New variables are extracted from existing data that help to understand the problem and develop its solution.
Documentation and Communication:
The results are documented in the form of a report and communicated to the stakeholders who can then make effective decisions based on the results of analysis.

Examples of Data Science and Analytics use
All the big companies as well as small businesses from all walks of the global market make use of Data Science and Analytics to ensure smooth working in their business ventures and maximize profits in the market.
- Facebook utilizes Data science and analytics for targeted advertising as well as to smoothen the user experience.
- Uber is another app that employs Data science and analytics to deliver customer satisfaction and analysis of traffic patterns, high and low-demand areas, driver dispatching services, etc.
- Netflix, HBO MAX, and other streaming services provide personalized content to viewers by analyzing viewing history, ratings, and user preferences.
Conclusion
Data science and analytics are extremely useful and sought-after tools by businesses today whose scope of use today is as vast as the global market itself. It not only helps businesses to optimize their performance and grow by making effective decisions but also helps them deliver a comforting user experience to their customer leading to enhanced profits and increased reach.